
Open Stock Analysis
Open Stock Analysis (OSA) is a set of trading models built to do two things, in order: make money and protect your capital. Each model turns public and subscription data into a clear, rules-based action — with an entry, a stop and targets — so a trade is a deliberate decision, not an emotional one.
Our mission
1. Make money
Find high-probability trades and let the winners work: ranked ideas, entries and profit targets for day trades, swing trades and longer-term holds.
2. Protect your capital
Our primary mission. Every setup comes with a stop and a defined risk, because you cannot compound gains on money you have already lost. Capital preservation comes before any trade.
Three models, three jobs
Use the right model for the kind of trade you are making. SIP is for day trading. TAM is for swing trading and for spotting potential long-term holds. FAM provides the fundamental justification for a long hold.
OSA SIP — day trading
The Stocks In Play model finds the most active stocks of the day and ranks a day trade top 10 by relative volume, big moves and gaps, technical confirmation and fresh signals — with entry, stop and intraday targets.
OSA TAM — swing trades top 10
The Technical Analysis Model reads trend, momentum, volume and moving-average indicators to pick the best 10 swing trades, each with dated entry, average-down and sell points.
OSA FAM — long holds top 10
The Fundamental Analysis Model scores each company 0-100 on profitability, valuation, financial health, growth and the analyst view, and picks the best 10 long holds, each with entry, average-down and sell points.
Profiles and watch lists
OSA TAM reports for each profile's watch lists, with buy and sell targets and trend dates.
Technical Analysis Model
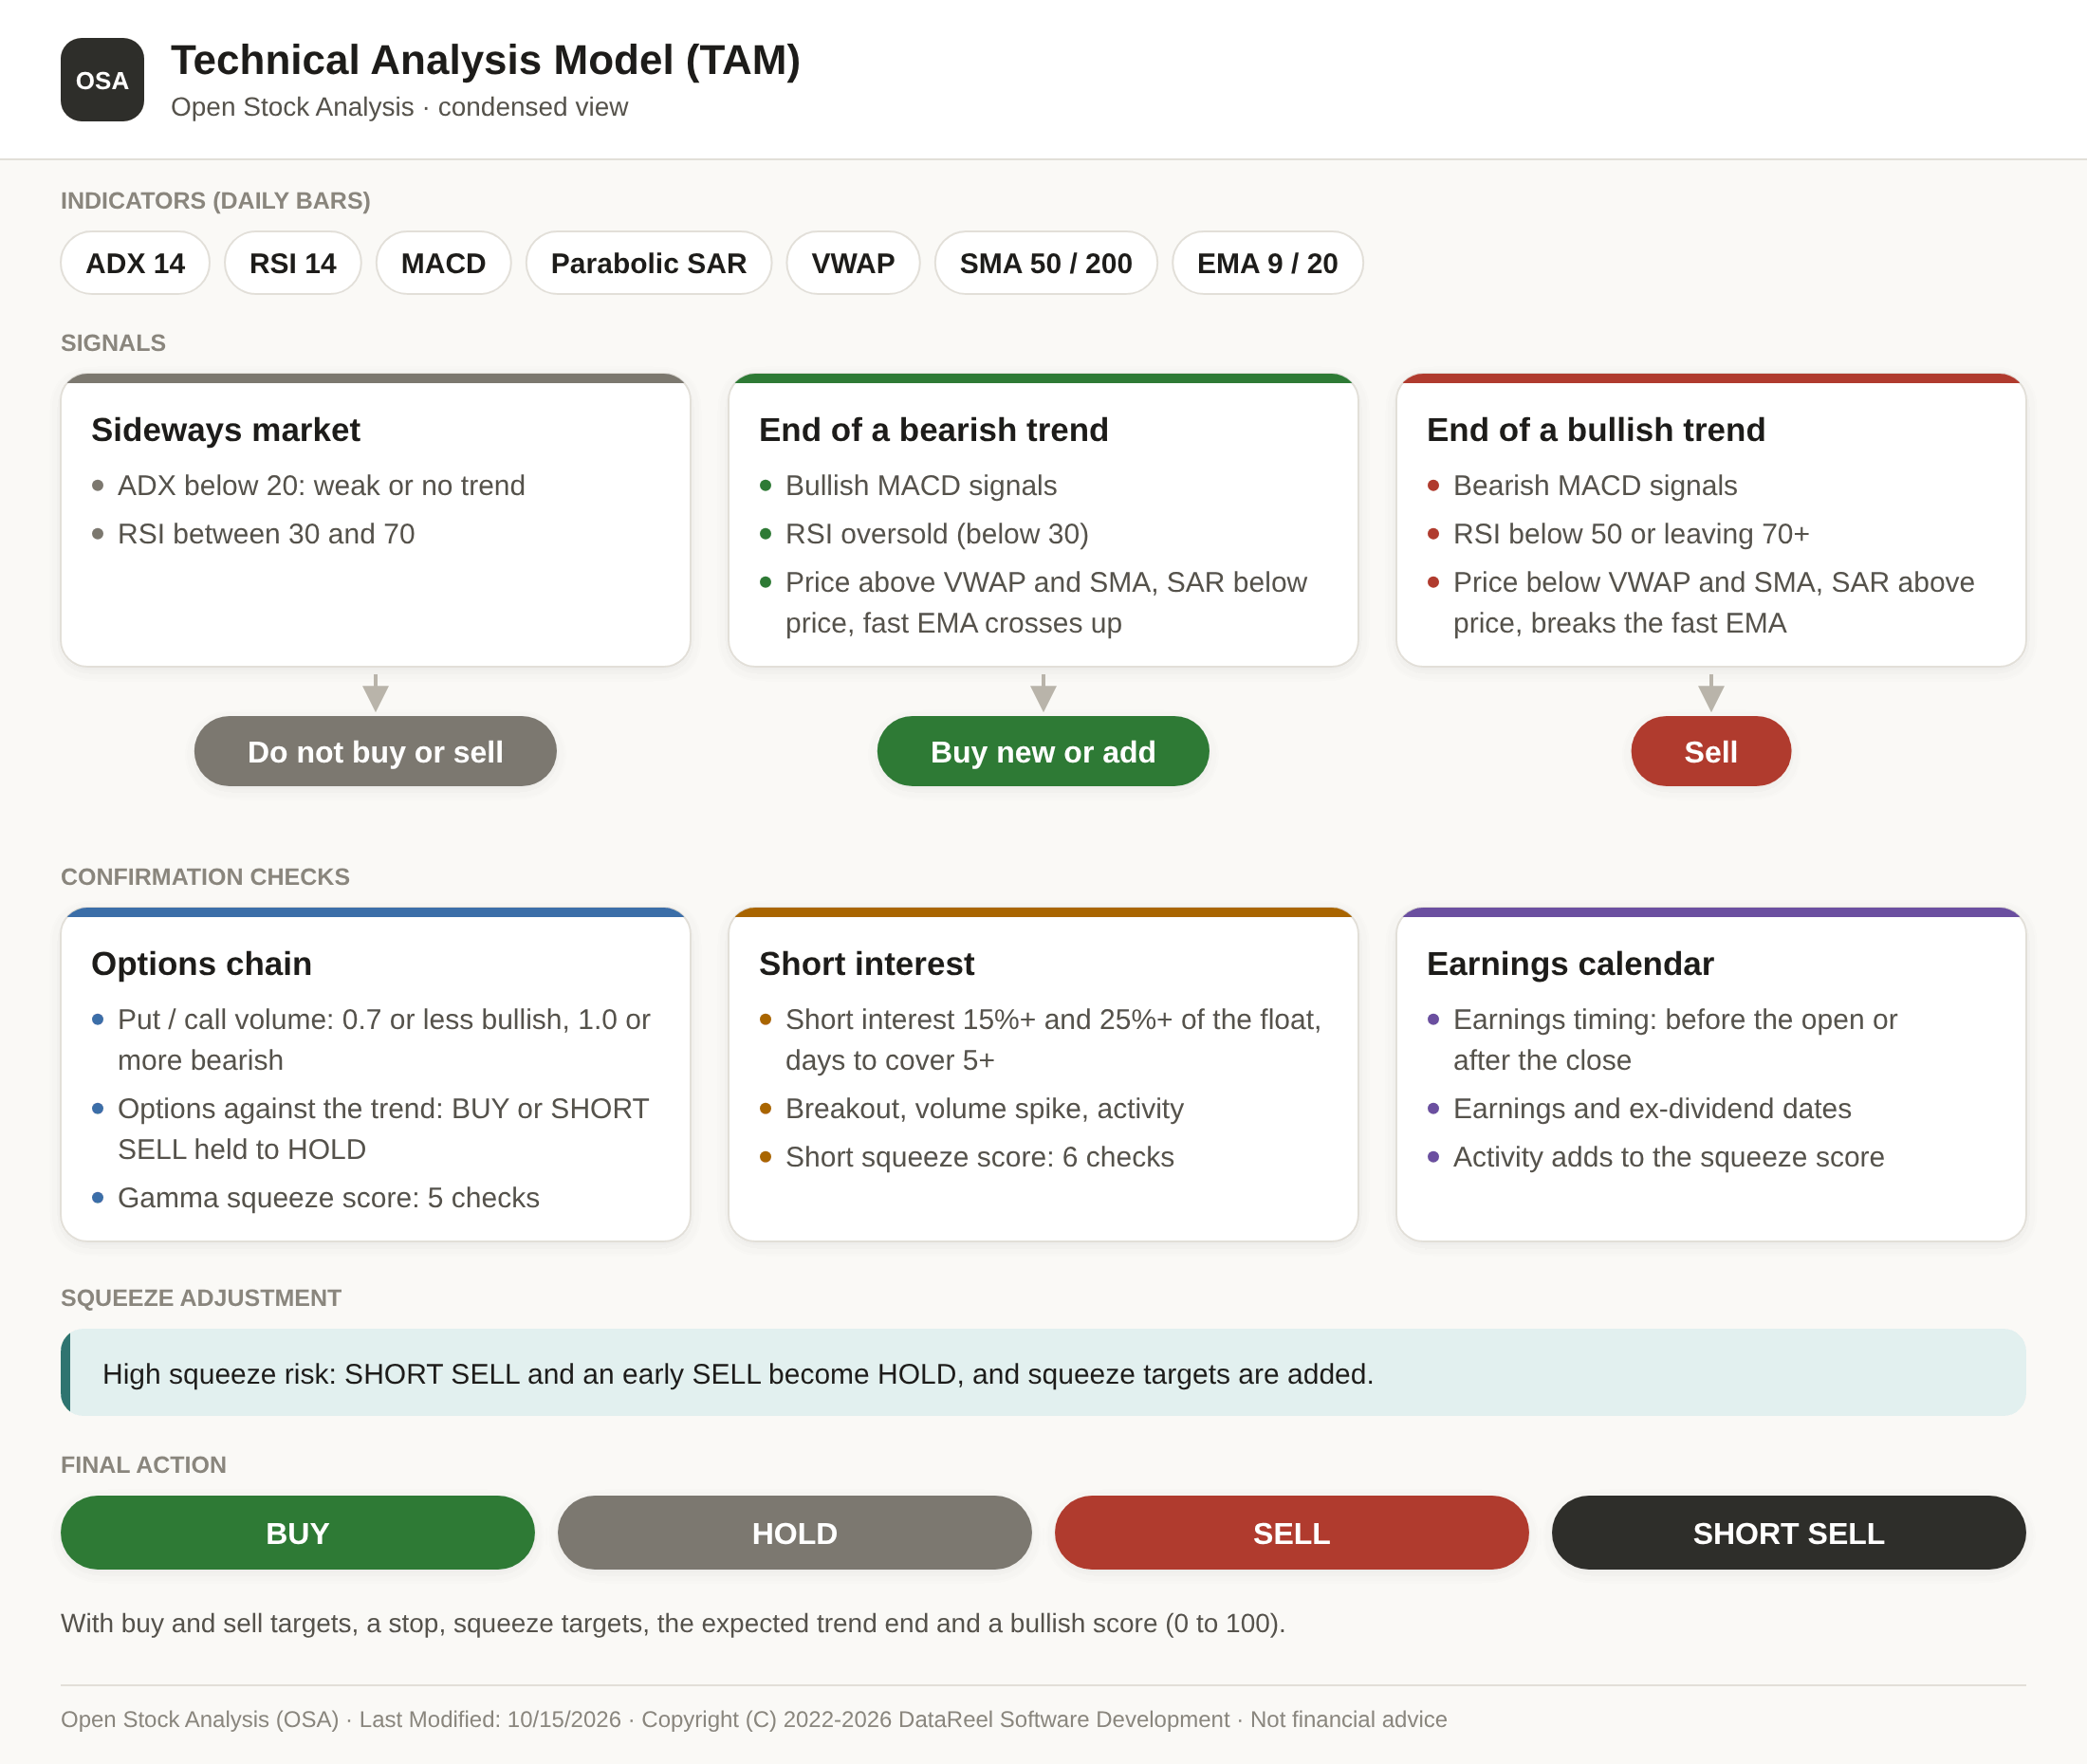
OSA TAM: a decision flow from indicator signals to RSI and VWAP, SAR, SMA and EMA confirmation, checked against the options chain, short interest and the earnings calendar, ending in BUY, HOLD, SELL or SHORT SELL.
User Login
For users given access to content that is not on the public site. Access requires a login and acceptance of the confidentiality terms.
How the public model works

- Look for sideways movement ADX below 20 signals a weak or absent trend; RSI bouncing between 30 and 70 confirms it. Do not buy or sell.
- Look for the end of a bearish trend Bullish MACD signals and an oversold RSI, confirmed by price moving above VWAP and the baseline SMA, SAR flipping below price and a fast EMA crossing above a slow EMA. Buy new or add.
- Look for the end of a bullish trend Bearish MACD signals and RSI leaving overbought, confirmed by price closing below VWAP and the baseline SMA, SAR flipping above price and price breaking below the fast EMA. Sell.
- Confirm with the options chain, short interest and the earnings calendar Put / call volume and unusual options confirm or hold back the signal; gamma and short squeeze checks and the earnings and ex-dividend dates can turn a SELL or SHORT SELL into a HOLD. The desktop apps (run on your own install) add the full catalyst analysis.
Technical indicators
- ADX Average Directional Index
- RSI Relative Strength Index
- MACD Moving Average Convergence Divergence
- VWAP Volume-Weighted Average Price
- SAR Parabolic Stop and Reverse
- SMA Simple Moving Average 50 and 200
- EMA Exponential Moving Average 9 and 20
The OSA TAM watch list
The TAM open stock watch list is the set of stocks that have been part of OSA model development from 2022 through 2026. They are the names the models were built and tested against, carried through every version of TAM, SIP and FAM.
Your feedback
Please submit your TAM, SIP and/or FAM comments through our contact form. Feedback on the models, the picks and the site all helps make OSA better.
Open Stock Analysis is for education and research. It is not financial advice. Do your own research before trading.